CME has been walking around with spinach in its teeth for more than 10 years. And although my midwestern mindset defaults to “don’t make waves,” I think it’s officially time to offer a toothpick to progress and pluck that pesky control group from the front teeth of our standard outcomes methodology.
That’s right, CME control groups are bunk. Sure, they make sense at first glance: randomized controlled trials (RCTs) use control groups, and they’re the empirical gold standard. However, as we’ll see, the magic of RCTs is the randomization, not the control: without the “R,” the “C” falls flat. Moreover, efforts to demographically match controls to CME participants on a few simple factors (e.g., degree, specialty, practice type, self-reported patient experience) fall well short of the vast assemblage of confounders that could account for differences between these groups. In the end, only you can prevent forest fires, and only randomization can ensure balance between samples.
So let’s dig into this randomization thing. Imagine you wanted to determine the efficacy of a new treatment for detrimental modesty (a condition in which individuals are unable to communicate mildly embarrassing facts). A review of clinical history shows that individuals who suffer from this condition represent a wide range of race, ethnicity, and socioeconomic strata, as well as vary in health metrics such as age, BMI, and comorbidities. Accordingly, you recruit a sufficient sample* of patients with this diagnosis and randomly designate them into two categories: 1) those who will receive the new treatment, and 2) those who will receive a placebo. The purpose of this randomization is to balance the factors that could confound the relationship you wish to examine (i.e., treatment outcome). Assume the outcome of interest is the likelihood to tell a stranger he has spinach in his teeth. Is there a limit to the number of factors you can imagine that might influence an individual’s ability for such candor? And remember, clinical history indicated that patients with detrimental modesty are diverse with regard to social and physical characteristics. How can you know that age, gender, height, religious affiliation, ethnicity, or odontophobia won’t enhance or reduce the effect of your treatment? If these factors are not evenly distributed across the treatment and control groups, your conclusion about treatment efficacy will be confounded.
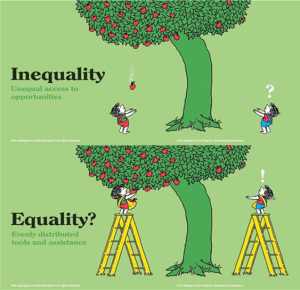
So…you could attempt to match the treatment and control groups on all potential confounders or you could take the considerably less burdensome route and simply randomize your subjects into either group. Although all of these potential confounders still exist, randomization ensures that the treatment and control groups are equally “not uniform” across all these factors and, therefore, comparable. It’s very important to note that the “control” group is simply what you call the population who doesn’t receive treatment. The only reason it works is because of randomization. Accordingly, simply applying a control group to your CME outcome assessment without randomization is like giving a broke man a wallet – it’s so not the thing that matters.
Now let’s bring this understanding to CME. There are approximately 18,000 oncology physicians in the United States. In only two scenarios will the participants in your oncology-focused CME represent an unbiased sample of this population: 1) all 18,000 physicians participate, or 2) at least 377† participate (sounds much more likely) who have been randomly sampled (wait…what?). For option #2, the CME provider would require access to the entire population of oncology physicians from which they would apply a randomization scheme to create a sample based on their empirically expected response rate to invitations in order to achieve the 377 participation target. Probably not standard practice. If neither scenario applies to your CME activity, then the participants are a biased representation of your target learners. Of note, biased doesn’t mean bad. It just means that there are likely factors that differentiate your CME participants from the overall population of target learners and, most importantly, that these factors could influence your target outcomes. How many potential factors? Some CME researchers suggest more than 30.
Now think about a control group. Are you pulling a random sample of your target physician population? See scenario #2 above. Also, are you having any difficulty attracting physicians to participate in control surveys? What’s your typical response rate? Do you use incentives to help? Does it seem plausible that the physicians who choose to respond to your control group surveys would be distinct from the overall physician population you hope they represent? Do you think matching this control group to participants based on profession, specialty, practice location, and practice type is sufficient to balance these groups? Remember, it’s not the control group that matters, it’s the randomization. RCTs would be a lot less cumbersome if they had to match comparison groups on only four factors. Of course, our resulting pharmacy would be terrifying.
So, based on current methods, we’re comparing a biased sample of CME participants to a biased sample of nonparticipants (control) and attributing any measured differences to CME exposure. This is a flawed model. Without balancing the inherent differences between these two samples, it is impossible to associate any measured differences in response to survey questions with any specific exposure. So why are you finding significant differences (i.e., P < .05) between groups? Because they are different. The problem is we have no idea why.
By what complicated method can we pluck this pesky piece of spinach? Simple pre- vs. post-activity comparison. Remember, we want to ensure that confounding factors are balanced between comparison groups. Although participants in your CME activity will always provide a biased representation of your overall target learner population, those biases are balanced when participants are used as their own controls (as in the pre- vs. post-activity comparison). That is, both comparison groups are equally “non-uniform” in that they are composed of the same individuals. In the end, you won’t know how participants differ from nonparticipants, but you will be able to associate post-activity changes to your CME.


